Explore Library
Create a Lessn
Select Grade
Pre-K
Kindergarten
First Grade
Second Grade
Third Grade
Fourth Grade
Fifth Grade
Sixth Grade
Seventh Grade
Eighth Grade
High school
Select Subject
Arts and humanities
Economics
Language arts
Life skills
Math
Science
Social Studies
Login
Register
Login
Register
Explore Library
Create a Lessn
Select Grade
Pre-K
Kindergarten
First Grade
Second Grade
Third Grade
Fourth Grade
Fifth Grade
Sixth Grade
Seventh Grade
Eighth Grade
High school
Select Subject
Arts and humanities
Economics
Language arts
Life skills
Math
Science
Social Studies
Explore Lessn Library
Filters
Filters
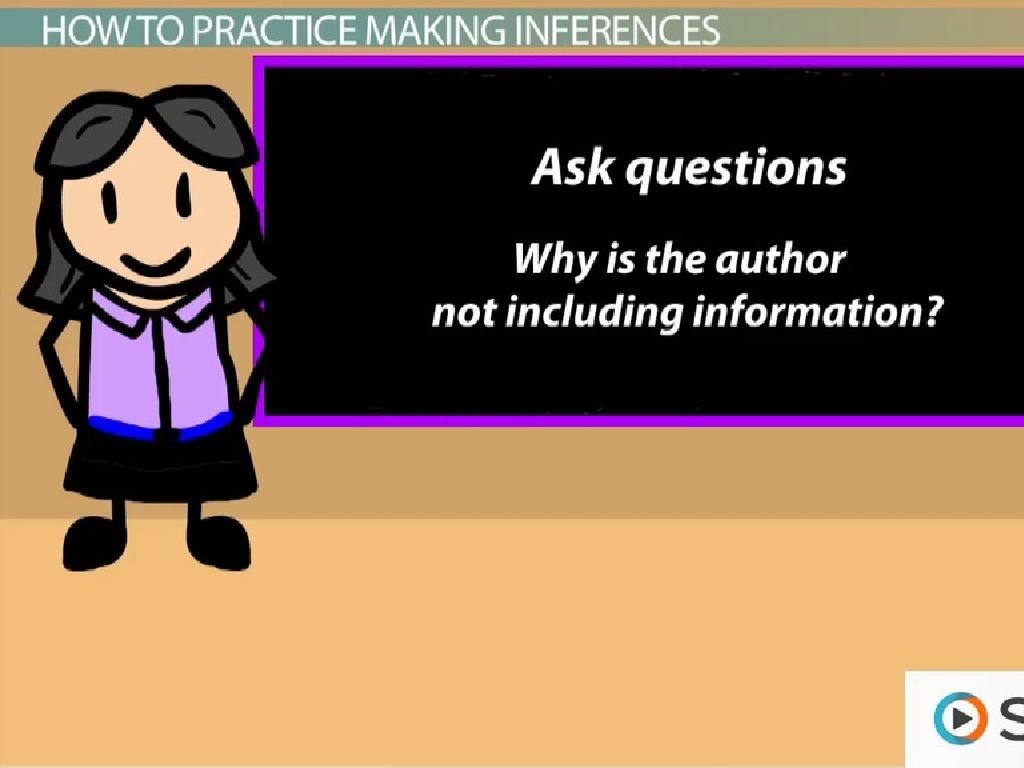
Analyzing Literature
Draw Inferences From Liter...
Language arts
Sixth grade
View Presentation
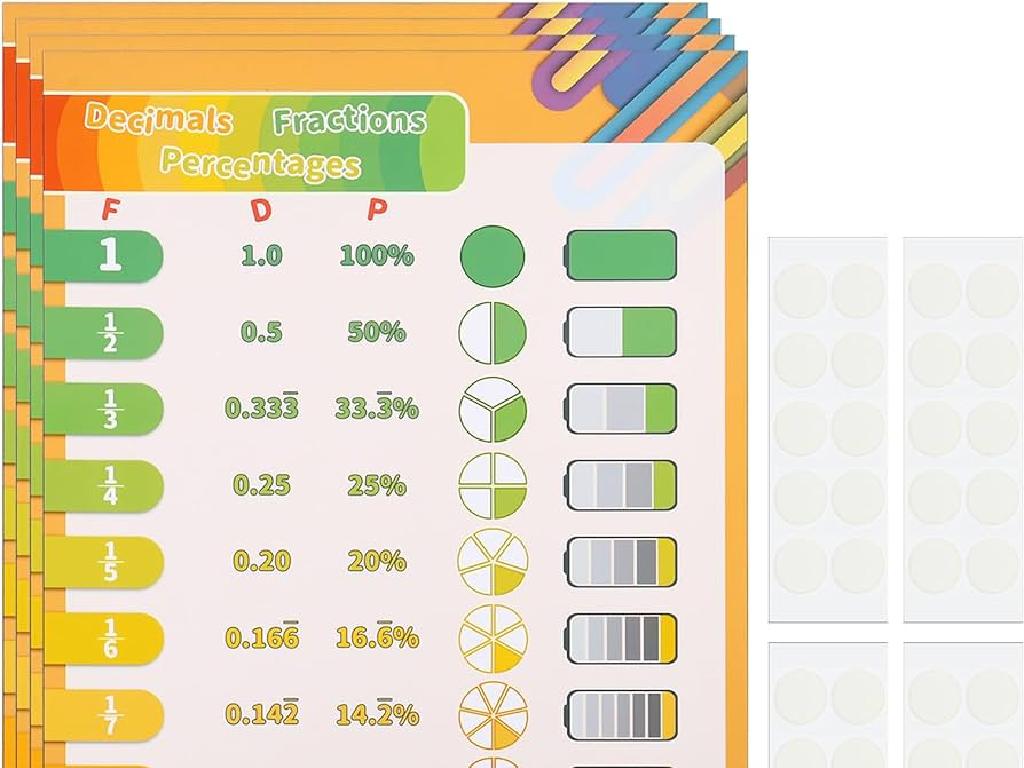
Fractions And Decimals
Convert Decimals To Fracti...
Math
Sixth grade
View Presentation
Ratios And Rates
Solve The Proportion
Math
Sixth grade
View Presentation
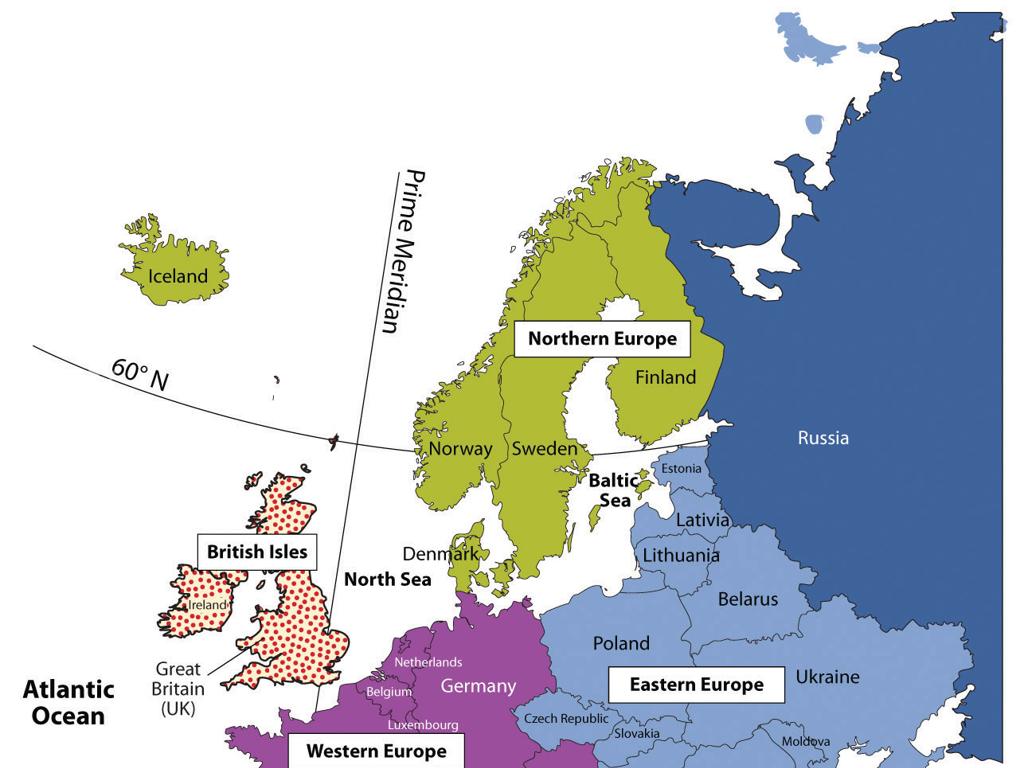
Europe: Geography
Identify And Select Countr...
Social studies
Sixth grade
View Presentation
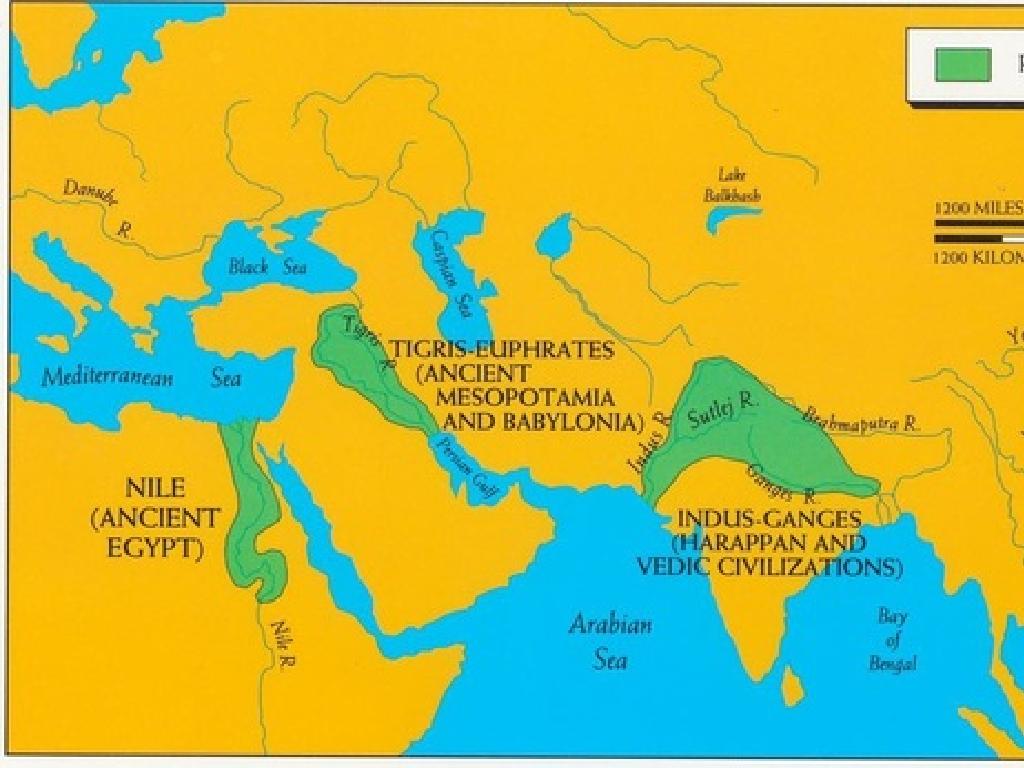
Comparing Ancient River Civilizations
Compare Ancient River Civi...
Social studies
Sixth grade
View Presentation
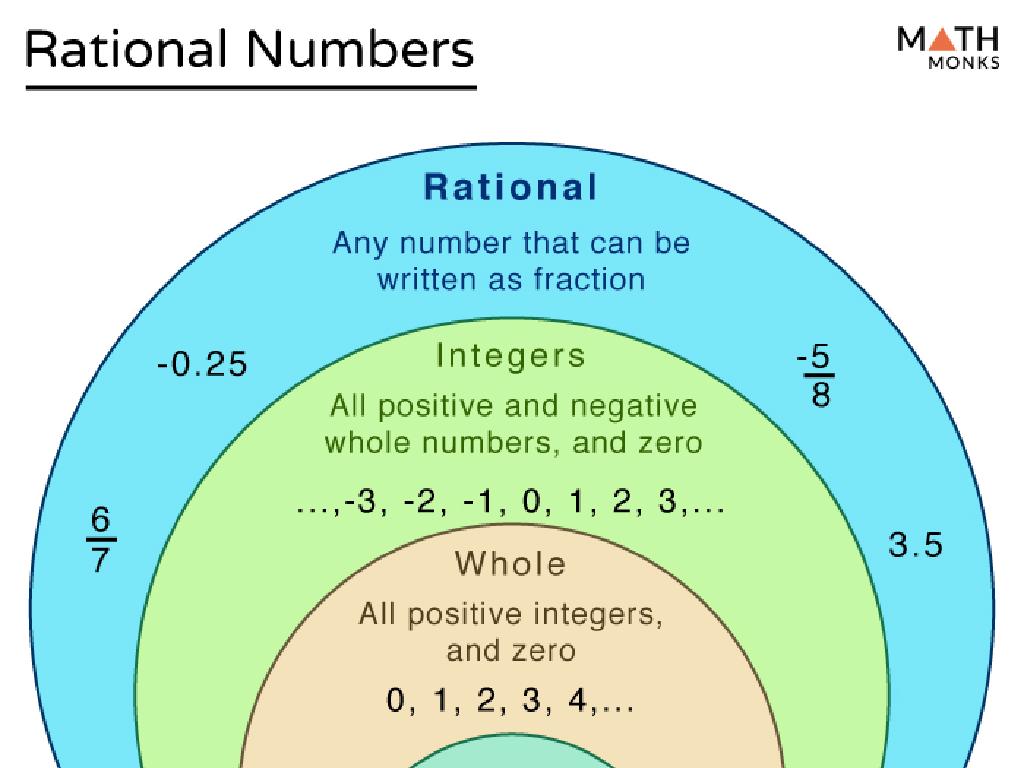
Rational Numbers
Rational Numbers: Find The...
Math
Sixth grade
View Presentation
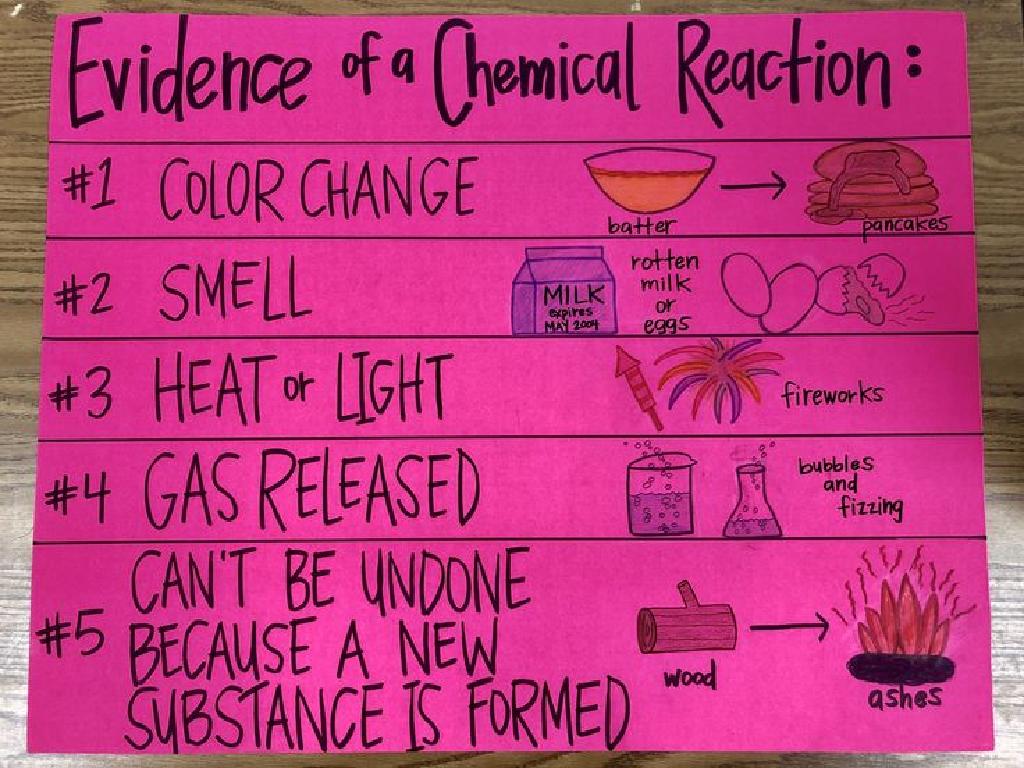
Chemical Reactions
Calculate Amounts Of React...
Science
Sixth grade
View Presentation
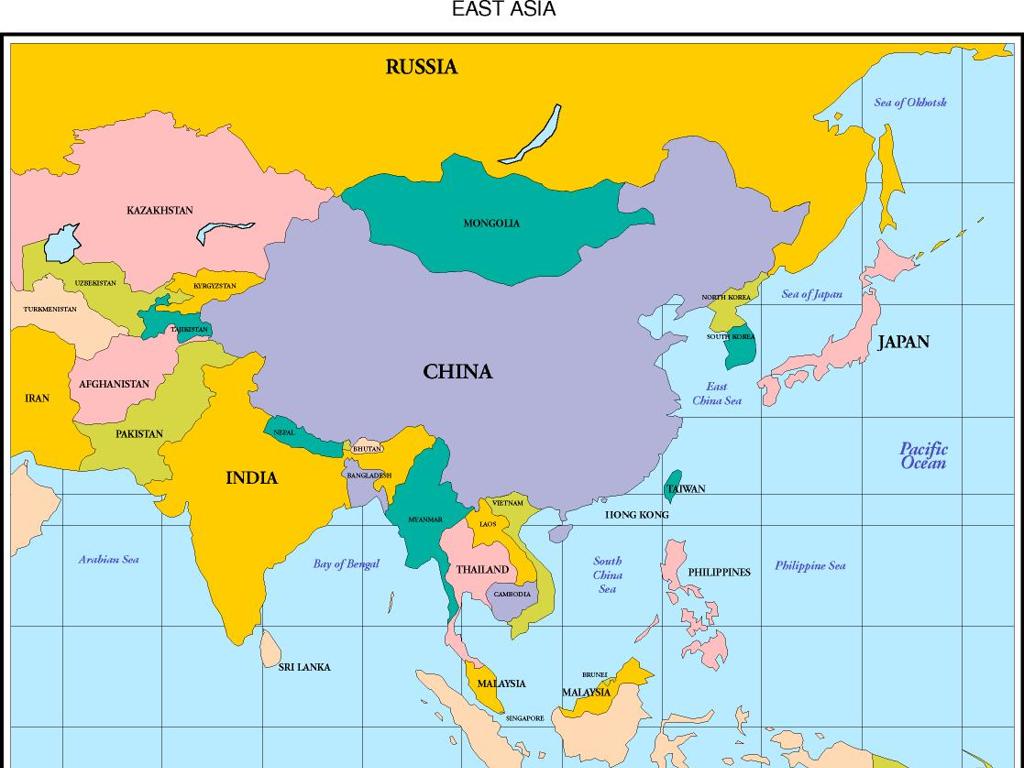
Asia: Geography
Name Countries Of Asia: Re...
Social studies
Sixth grade
View Presentation
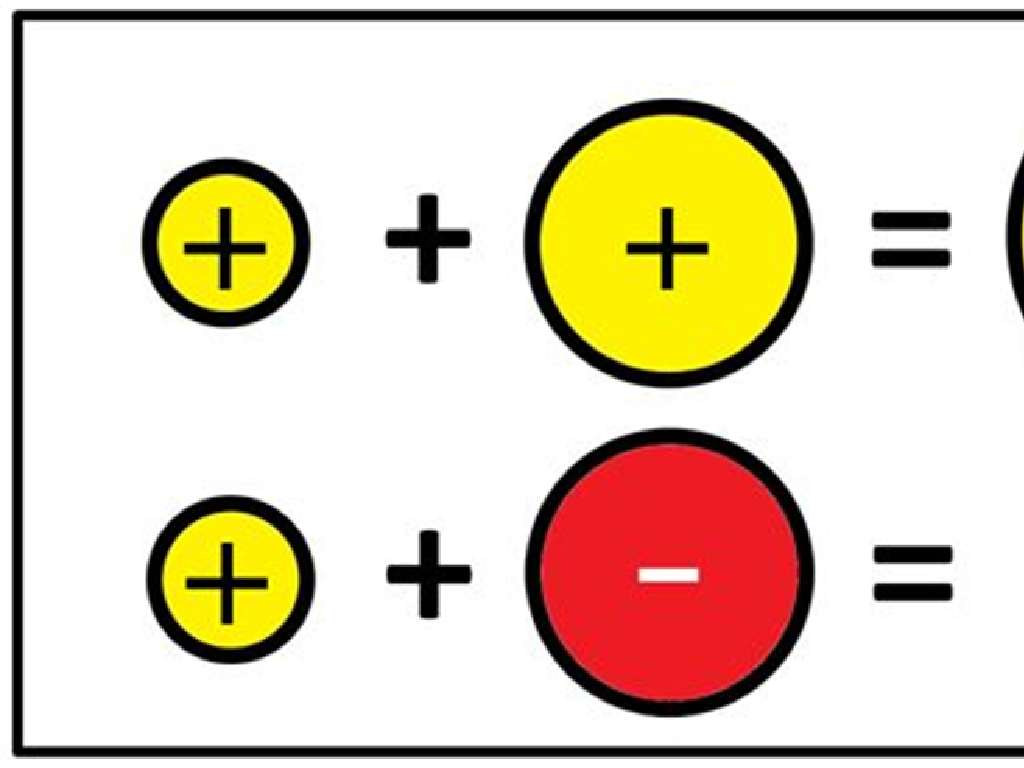
Operations With Integers
Subtract Integers
Math
Sixth grade
View Presentation
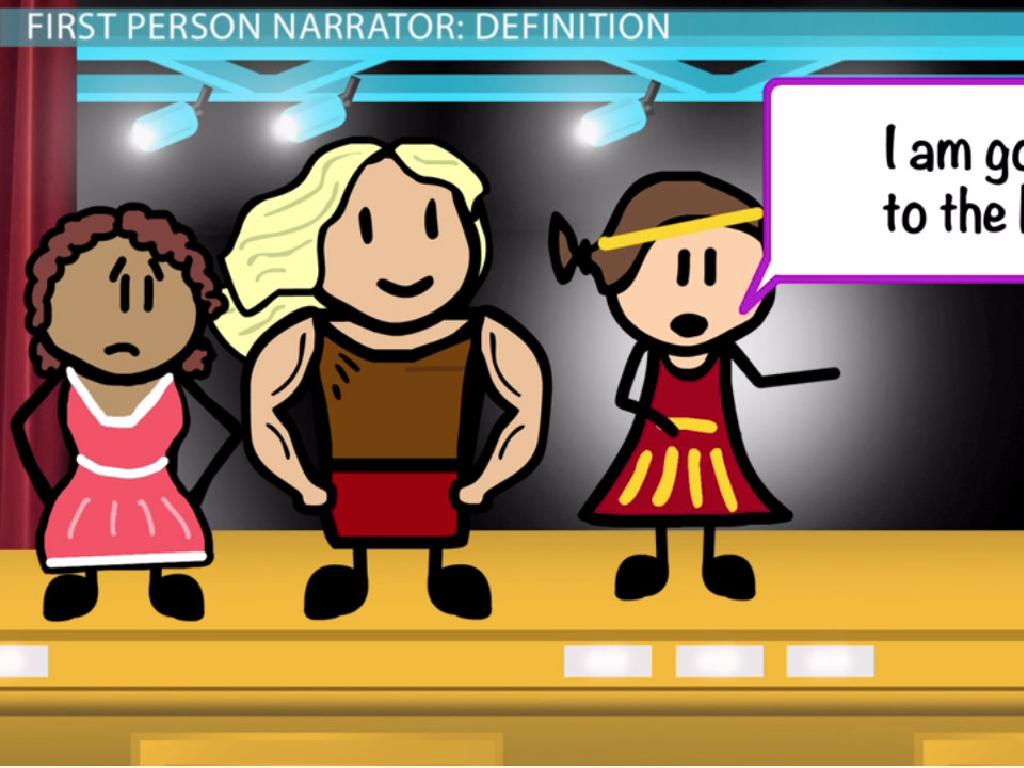
Point Of View
Identify The Narrative Poi...
Language arts
Sixth grade
View Presentation
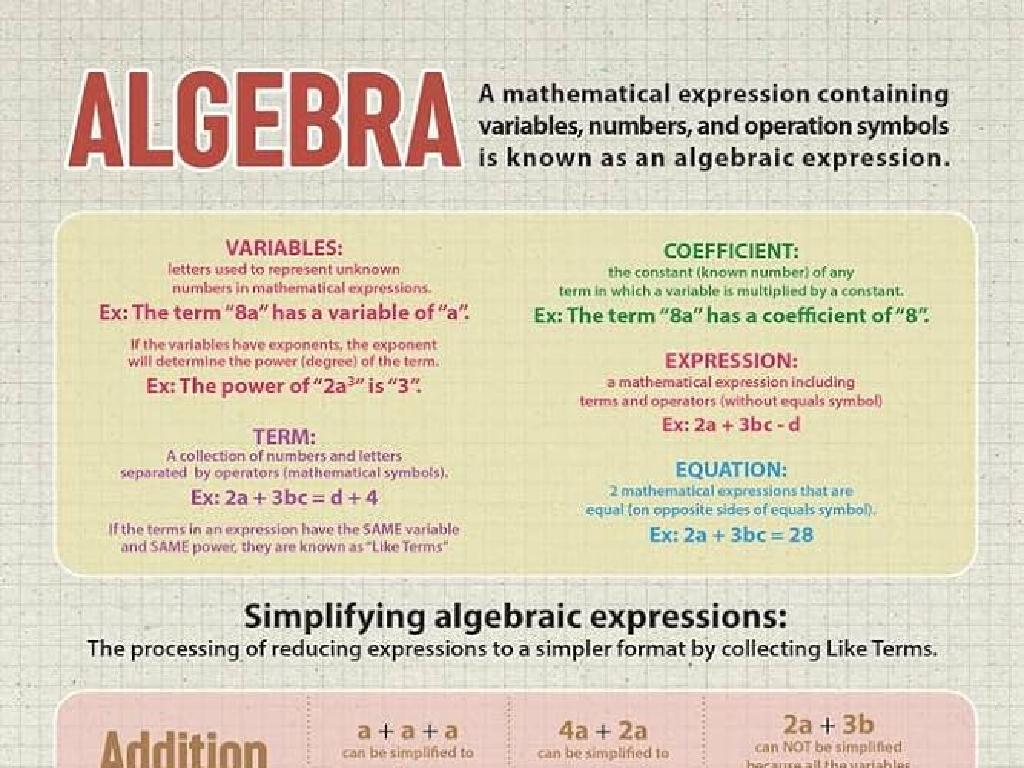
Expressions
Identify Terms And Coeffic...
Math
Sixth grade
View Presentation
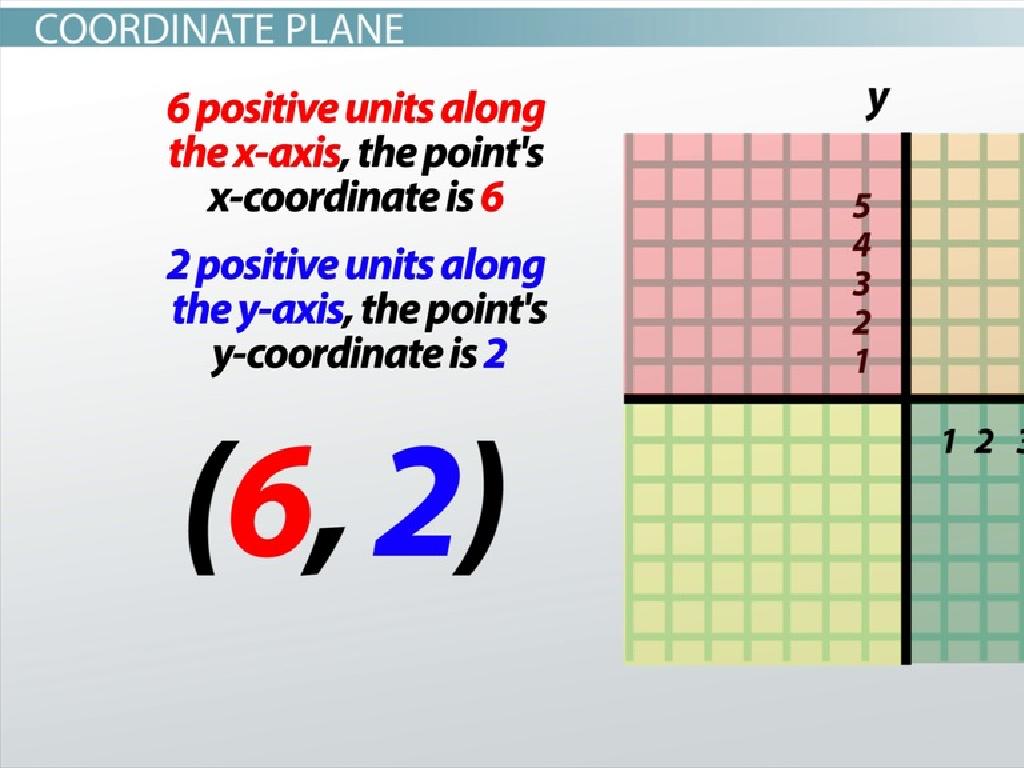
Coordinate Plane
Objects On A Coordinate Pl...
Math
Sixth grade
View Presentation
Scroll to Top