
Calculate The Averages Of Traits In A Population
Subject: Science
Grade: Seventh grade
Topic: Adaptations And Natural Selection
Please LOG IN to download the presentation. Access is available to registered users only.
View More Content


Adaptations and Natural Selection
– Species adapt to environments
– Adaptations are traits that help survival and reproduction in specific habitats.
– Natural selection explained
– Natural selection is nature’s way of selecting the best-adapted traits to survive.
– Traits change over time
– Over generations, certain traits become more common while others may disappear.
– Calculating trait averages
– We can measure these changes by calculating the average traits within a population.
|
This slide introduces the foundational concepts of adaptations and natural selection, which are crucial for understanding evolution. Adaptations are the physical or behavioral characteristics that have developed to allow an organism to better survive in its environment. Natural selection is the process by which these beneficial adaptations become more common in a population over time. Emphasize that traits can be quantified and averaged, and this data can show us how a population evolves. Encourage students to think of examples of adaptations in animals they are familiar with, and how these might have come about through natural selection. In the next part of the lesson, we will explore how to calculate the average of traits in a population, which will help students understand the practical aspect of this concept.
Traits in Populations: Calculating Averages
– Define traits in biology
– Traits are characteristics inherited genetically.
– Trait variation in populations
– Populations have a mix of traits, showing diversity.
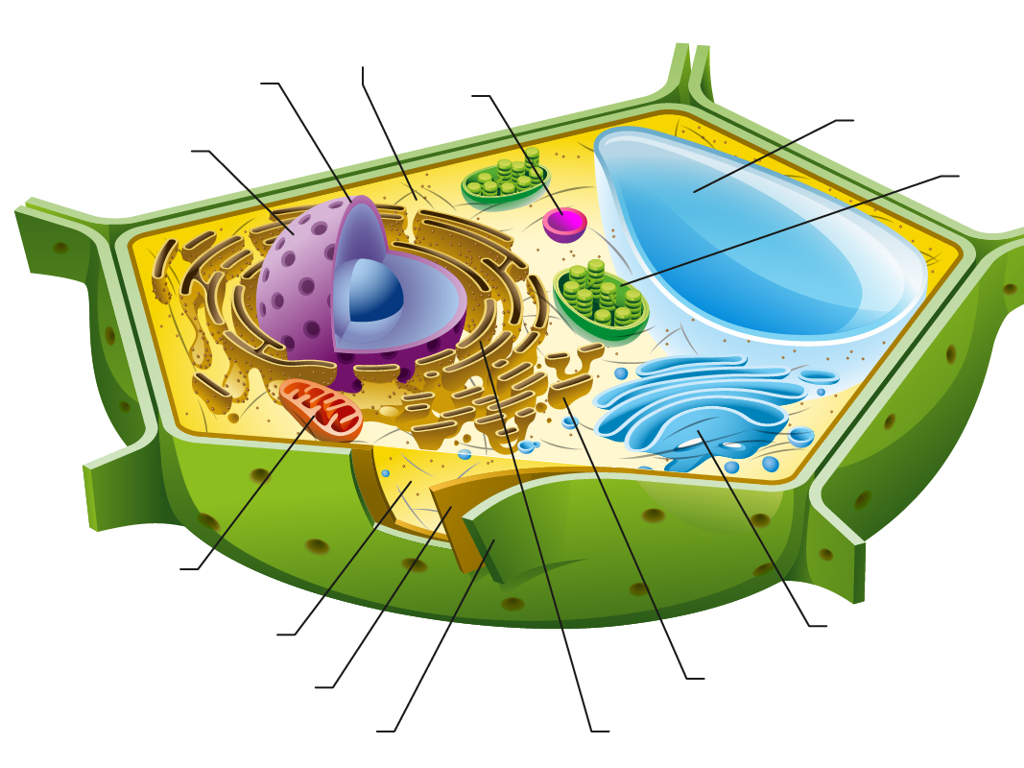
– Animal and plant trait examples
– Examples: Fur color in rabbits, leaf size in plants.
– Calculating trait averages
– Average traits help understand population adaptation.
|
This slide introduces the concept of traits within the context of biology and their importance in understanding population diversity. Traits are inherited characteristics that can vary widely within a population, providing a basis for natural selection. Discuss examples of traits in both animals and plants to give students a concrete understanding. Emphasize the role of calculating averages of these traits to study how populations adapt over time. Encourage students to think of traits they can observe in nature and how these might vary. The slide sets the stage for further exploration into how these variations contribute to survival and reproduction in the face of environmental challenges.
Calculating Averages in Populations
– Understanding averages
– An average is a single value representing the sum of values divided by their count.
– Steps to calculate averages
– Add all numbers together, then divide by the number of values.
– Practice with rabbit ear lengths
– Calculate the mean ear length from a sample of rabbit population data.
– Application in natural selection
– Averages help us understand traits within a population and their role in adaptation.
|
This slide introduces the concept of averages as it applies to traits in a population, an important aspect of understanding adaptations and natural selection. Start by defining an average and its significance in summarizing data. Walk through the process of calculating an average with a simple example, such as finding the mean of a set of numbers. Then, engage students with a hands-on activity to calculate the average ear length of rabbits, using sample data. This exercise will help them grasp how averages can provide insights into the characteristics of a population and the implications for survival and reproduction in the context of natural selection. Encourage students to consider how traits with higher or lower averages might affect an organism’s ability to thrive in its environment.
Averages of Traits in Populations
– Importance of trait averages
Averages help in understanding the general characteristics of a population.
– Averages show adaptation overview
Seeing the big picture of how a population adapts over time is facilitated by averages.
– Group activity: Calculate averages
Use provided data to find the mean trait value in groups.
– Analyzing average trait values
|
Understanding the average of traits within a population is crucial for grasping the concept of natural selection and adaptation. It allows students to see beyond individual variations and focus on the population as a whole. This understanding is key in evolutionary biology. The group activity is designed to reinforce this concept by having students work with actual data to calculate average trait values. This hands-on experience will help solidify their understanding of how traits within a population can give insights into the adaptive processes. Provide students with data sets representing different traits within a population and guide them through the process of calculating the mean for each trait. Encourage discussion on how these averages can indicate the presence of certain adaptations within the population.
Natural Selection and Trait Averages
– Natural selection’s impact on traits
– Traits that aid survival become more common over generations.
– Environmental pressures’ role
– Factors like climate & predators influence which traits are favorable.
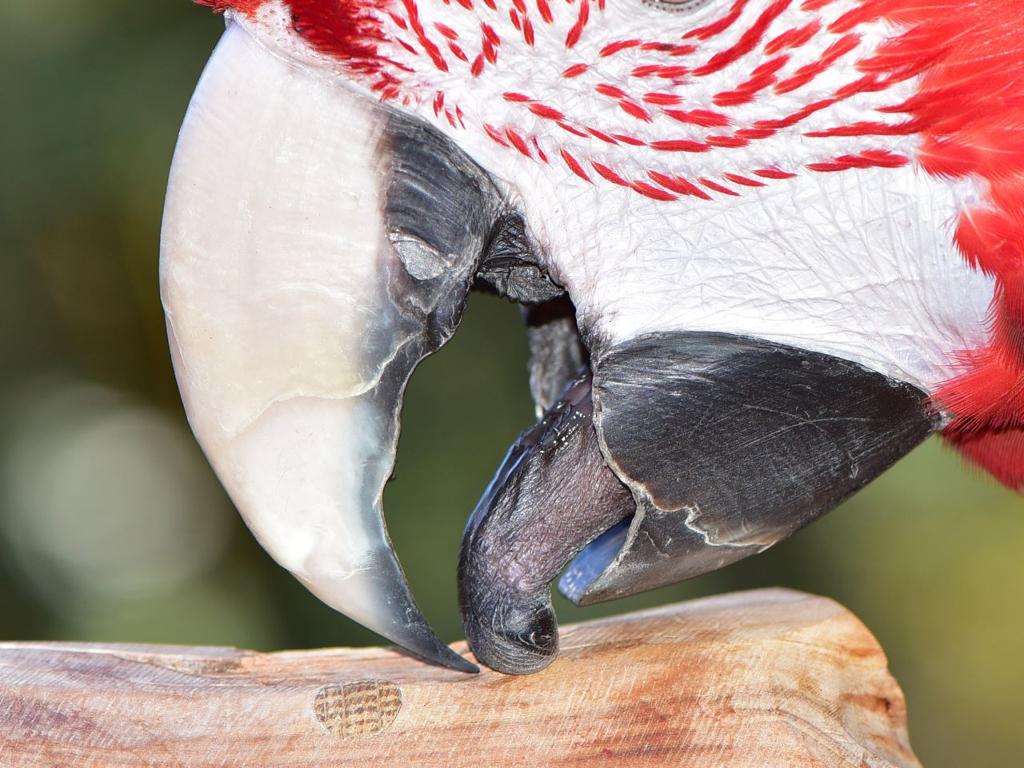
– Case Study: Galápagos finches
– Study how finch beak sizes changed due to food availability.
– Analyzing finch beak sizes
– Calculate average beak size before and after environmental changes.
|
This slide aims to explain how natural selection can influence the average traits within a population. It’s important to highlight that traits which improve survival and reproduction chances tend to become more common over time. Environmental pressures, such as changes in climate or predator behaviors, can determine which traits are advantageous. The case study of the Galápagos finches provides a concrete example of this process in action, where finch beak sizes evolved due to changes in available food sources. Students should learn how to calculate the average beak sizes and understand how these averages can shift due to natural selection. Encourage students to think critically about how environmental changes can affect populations over time.
Class Activity: Simulating Natural Selection
– Understand natural selection simulation
– Receive unique environments and populations
– Calculate average traits over generations
– Use the provided data to compute the trait averages
– Observe changes in population traits
– Discuss how traits have evolved or changed
|
This activity is designed to help students grasp the concept of natural selection by actively participating in a simulation. Each group will be given a different set of environmental conditions and a starting population. Students will simulate ‘generations’ of the population and calculate the average trait (e.g., beak size, fur color) after each generation. They should observe how the population’s traits change over time due to the environmental pressures. As a teacher, facilitate the activity by ensuring each group understands their task, providing assistance with calculations as needed, and leading a discussion afterward to reflect on the simulation outcomes. Possible variations for different groups could include different starting traits, varying environmental challenges, or introducing random events that could affect the population.
Conclusion: Averages & Natural Selection
– Recap trait average calculation
– Sum up the steps to find trait averages in a population
– Natural selection’s impact
– How natural selection influences trait distribution over time
– Engage in Q&A session
– Summarize key concepts
– Review the main points of today’s lesson
|
This slide aims to consolidate the students’ understanding of calculating trait averages and the role of natural selection in shaping populations. Begin by summarizing the method for calculating averages, ensuring students are clear on adding up all the values of a trait and dividing by the number of individuals. Highlight how natural selection can shift these averages by favoring certain traits over others, leading to changes in the population over generations. The Q&A session is crucial for addressing any lingering uncertainties and reinforcing the lesson’s concepts. Conclude by summarizing the key points to reinforce learning and provide a clear takeaway from the class.