
Ratios And Rates: Complete A Table And Make A Graph
Subject: Math
Grade: Sixth grade
Topic: Ratios And Rates
Please LOG IN to download the presentation. Access is available to registered users only.
View More Content


Welcome to Ratios and Rates!
– Understanding ratios and rates
– A ratio compares two quantities, like 2 apples for every 3 oranges.
– Ratios and rates in daily life
– Use ratios for cooking recipes or calculating speed (miles per hour).
– Today’s goal: Table and graph
– Learn to organize ratios in tables and represent them visually in graphs.
– Practice with real examples
– We’ll use examples like mixing paint colors or comparing distances.
|
This slide introduces students to the concept of ratios and rates, setting the stage for today’s lesson on completing tables and making graphs based on these comparisons. Start by explaining that a ratio is a way to compare two quantities, which can be anything from ingredients in a recipe to the speed of a car. Show how these ratios are used in everyday life, making the lesson relevant and engaging. The goal for today is to ensure students can take a set of ratios and rates, organize them into a table, and then create a graph to visually represent the data. Use relatable examples like mixing paint to get a new color or comparing the distances between different cities. This practical application helps students grasp the concept and see the value in learning it. The notes should guide the teacher through the lesson, providing context and examples to use during the presentation.
Understanding Ratios
– Definition of a ratio
– A ratio shows how two values compare
– Ways to write ratios
– Ratios can be 3 to 4, 3:4, or 3/4
– Example of a ratio
– If 3 apples and 4 oranges, ratio is 3 to 4
– Practice finding ratios
|
This slide introduces the concept of ratios, which are a fundamental part of understanding relationships between quantities. Explain that a ratio is a way to show the relative size or amount of one thing compared to another. Emphasize the three common ways to write ratios and ensure students can convert between them. Use everyday examples, like comparing apples to oranges, to make the concept relatable. Encourage students to find ratios in the classroom, like the number of desks to chairs. This will prepare them for more complex problems involving ratios and rates.
Understanding Rates
– Define a rate
– A rate compares two different units, like miles to hours.
– Example of a rate
– 60 mph means 60 miles in 1 hour.
– Rates in daily life
– Driving speed, price of items per pound, or heartbeats per minute.
– Practice finding rates
|
This slide introduces the concept of rates, which are a specific type of ratio used to compare two quantities with different units. Start by defining a rate and then provide a common example, such as speed in miles per hour, to illustrate the concept. Highlight how rates are a part of everyday life, such as in driving where speed limits are given in miles per hour, or in shopping where prices are often listed per unit weight. Encourage students to think of other examples of rates they encounter daily. Conclude with an activity where students find rates in various scenarios, reinforcing their understanding of the concept.
Creating a Ratio Table
– Understanding ratio tables
– A tool to compare two quantities and their relationship.
– Multiplication & division in tables
– Use these operations to find missing values in the table.
– Example: Ratio of 2:3
– For every 2 of X, there are 3 of Y. How does this pattern continue?
– Completing the table
– Fill in missing numbers to maintain the ratio.
|
Introduce the concept of a ratio table to the students, explaining that it is a way to represent and compare two quantities. Emphasize the use of multiplication and division to find missing values and maintain the ratio. Use the example of a 2:3 ratio to illustrate how to complete the table. For instance, if we have 2 apples for every 3 oranges, what would be the number of apples for 6 oranges? (Answer: 4 apples). Encourage students to look for patterns and use them to fill in the table. This will help them understand how ratios work and how they can be represented graphically. Provide several examples and practice problems for students to complete their own ratio tables.
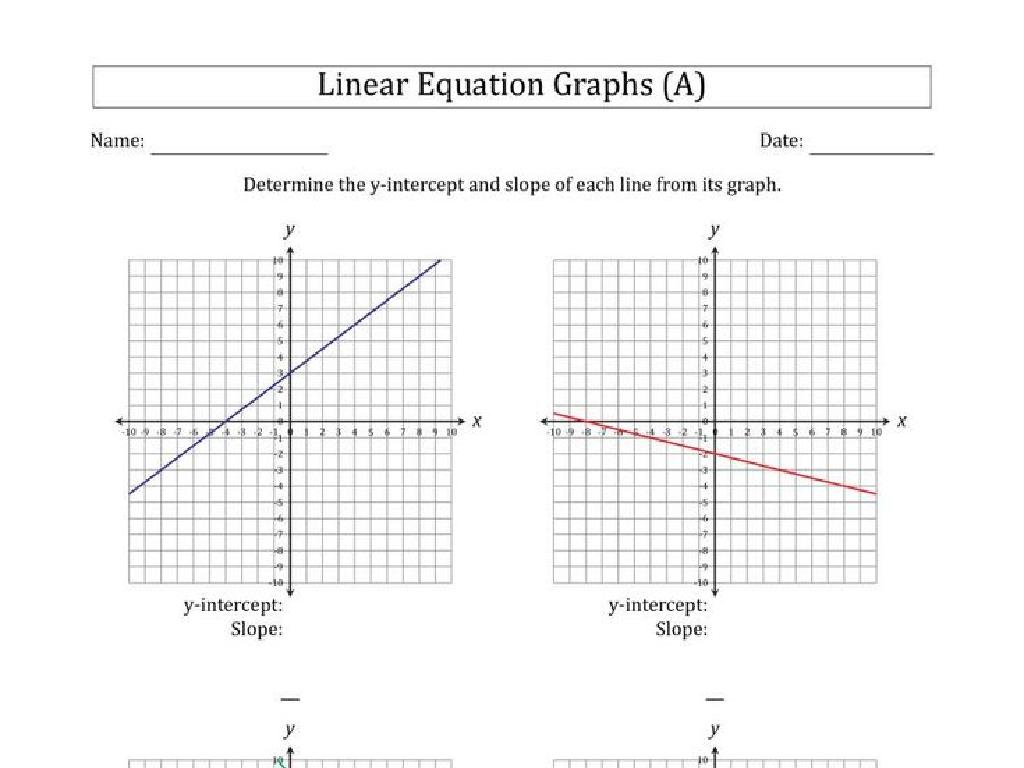
Graphing Ratios: Visualizing Relationships
– Graphs transform ratios into visuals
– Points represent number pairs
– Each point (x, y) matches a table entry
– Plotting on the coordinate plane
– We’ll use the x-axis and y-axis to plot
– Understanding ratio relationships
– See how one quantity changes with another
|
This slide introduces students to the concept of graphing ratios to create a visual representation of the relationship between two quantities. Emphasize that each point on a graph corresponds to a pair of numbers, which come directly from a table of ratios they’ve worked with. Demonstrate how to plot these points on a coordinate plane, using the horizontal (x-axis) and vertical (y-axis) to locate each point. Explain that this visual tool helps us understand how one quantity changes in relation to another, which is a fundamental aspect of ratios and rates. Provide examples and plan for hands-on activities where students can practice plotting points and interpreting graphs.
Let’s Practice Ratios and Rates!
– Complete a ratio table as a class
– Graph the ratios from the table
– Visualize ratios and rates
– See how ratios form a straight line on a graph
– Enhance understanding of concepts
– Connecting visual graphs to numerical tables solidifies comprehension
|
This slide is designed for a class activity to reinforce the concept of ratios and rates. Start by guiding the students through the process of completing a ratio table. Once the table is filled, move on to graphing these ratios on a coordinate plane. Emphasize that each pair of numbers in the table represents a point on the graph and that these points should form a straight line, illustrating the constant rate of change. This activity will help students to better visualize and understand the relationship between ratios, tables, and graphs. Possible activities include: 1) Comparing different brands of the same product to find the best buy, 2) Graphing the speed of different animals to see who is faster, 3) Creating a recipe conversion chart, 4) Graphing distances traveled over time during a road trip.
Class Activity: Ratio Relay
– Complete a ratio table in groups
– Graph your table on poster paper
– Present your graph to the class
– Explain your table and graph findings
Discuss how the ratio is represented on the graph and what patterns emerge
|
This activity is designed to reinforce the concept of ratios and their graphical representation. Divide the class into small groups and provide each with a different ratio to work with. Each group will fill in a ratio table based on their given ratio, then create a graph on poster paper to visually display the relationship between the quantities. After completing their graphs, groups will present their findings to the class, explaining the ratio and how it’s shown on their graph. Encourage students to identify and discuss any patterns they notice. For the teacher: Prepare different ratios for each group, ensure that poster paper and graphing materials are available, and guide students through the graphing process if necessary. Possible variations of the activity could include using different scales on the graphs or comparing the graphs of different groups to highlight how different ratios are represented visually.
Wrapping Up: Ratios and Rates
– Review ratios and rates concepts
– Real-life application of ratios
– Ratios help compare quantities, like in recipes or speed
– Homework: Worksheet completion
– Finish the provided worksheet on ratios and rates
– Graphing ratio results
– Use your worksheet answers to create a graph
|
As we conclude today’s lesson, it’s important to recap the key concepts of ratios and rates to solidify understanding. Discuss how ratios are used in everyday life, such as in cooking or determining speed. For homework, students are to complete the provided worksheet which will reinforce their learning. Additionally, they are tasked with graphing their results, which will help them visualize the relationship between the numbers. This exercise will also prepare them for the next class where we will discuss interpreting graphs. Encourage students to think of other areas where ratios and rates are applicable and to bring any questions they have to the next class.