Interpret A Graph: Word Problems
Subject: Math
Grade: Sixth grade
Topic: Two-Variable Equations
Please LOG IN to download the presentation. Access is available to registered users only.
View More Content
Interpreting Graphs with Word Problems
– Graphs translate numbers into visuals
– Visuals help us understand data quickly
– Each graph tells a numerical story
– Imagine a graph as a storybook of data
– Word problems connect stories to graphs
– We’ll learn to solve problems using graph clues
– Practice interpreting graphs today
|
This slide introduces students to the concept of using graphs to interpret numerical data through word problems. Graphs are visual representations that make complex data easier to understand at a glance. By viewing a graph as a story, students can relate to the information more personally, making the data more accessible. Today’s lesson will focus on connecting the narratives found in word problems to their corresponding graphical representations. Students will practice interpreting various types of graphs, understanding the ‘language’ they speak, and using this knowledge to solve real-world problems. Encourage students to think of graphs as a tool that translates numbers into a visual story that they can analyze and understand.
Understanding Two-Variable Equations
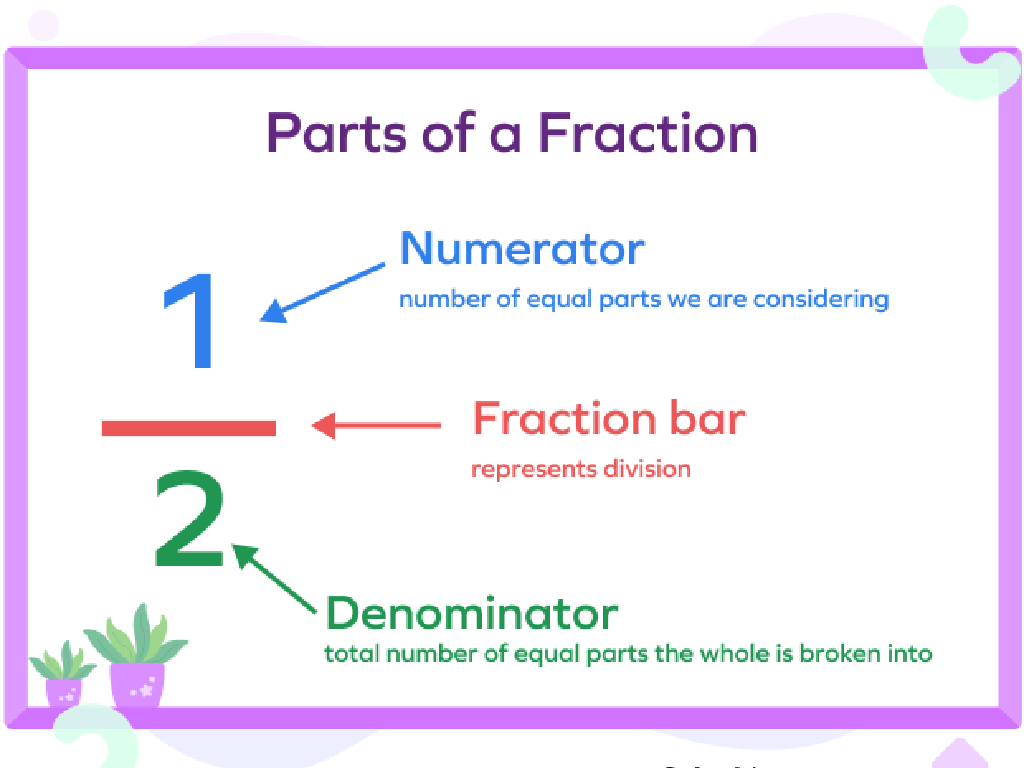
– Define two-variable equation
– An equation with two different variables, e.g., x and y in y = 2x + 3
– Examples of two-variable equations
– For instance, y = 2x + 3 or A = P + Prt (simple interest formula)
– Real-life two-variable models
– Budgeting allowance: A = P + Prt, where P is initial amount, r is rate of chores per week, and t is time in weeks
– Graph interpretation practice
|
This slide introduces students to the concept of two-variable equations, which are fundamental in algebra. Start by defining a two-variable equation and ensure students understand that these equations contain two different variables that are related in some way. Provide clear examples, such as linear equations in two variables, and relate them to real-life situations like budgeting an allowance or calculating distances over time. Encourage students to think of other examples where two-variable equations might apply. Conclude with an activity where students will practice interpreting graphs that represent two-variable equations, reinforcing their understanding through visual means.
Interpreting Graphs: Understanding the Basics
– Identify the X-axis and Y-axis
– The X-axis is horizontal, Y-axis is vertical
– Understand the Origin point
– Origin is where X-axis and Y-axis intersect (0,0)
– Learn to read graph scales
– Scales divide axes into units, measure accurately
– Practice with word problems
|
This slide introduces students to the fundamental parts of a graph, which is essential for solving word problems involving two-variable equations. Start by explaining the axes: the X-axis runs horizontally and usually represents the independent variable, while the Y-axis runs vertically for the dependent variable. The origin is the point where these axes intersect, and it’s the starting point for plotting data. Teach students how to read the scales on graphs, which can vary in increments. Emphasize the importance of understanding these concepts before attempting to interpret graphs in word problems. Provide examples and perhaps a simple in-class activity where students identify these parts on a printed graph.
Plotting Points on a Graph
– Understanding coordinates
– Coordinates are numbers that locate points on a graph, like (x, y).
– Steps to plot points
– Find x on the horizontal axis, then y on the vertical axis, and mark the point.
– Class activity: plotting practice
– We’ll plot points as a class on graph paper to practice.
– Importance of accurate plotting
– Accurate plotting is crucial for correct graph interpretation.
|
This slide introduces students to the concept of coordinates and how to plot them on a graph, which is a fundamental skill in interpreting graphs for word problems. Start by explaining that coordinates are a pair of numbers that show a precise location on a graph. Demonstrate the process of plotting points with clear steps: locate the x-coordinate on the horizontal axis, then find the y-coordinate on the vertical axis, and mark where they intersect. Engage the class with a hands-on activity where each student plots given points on graph paper. Emphasize the importance of plotting accurately to ensure the correct interpretation of data. Provide several examples with different coordinates for students to practice and become comfortable with the process.
Interpreting Graphs in Word Problems
– Understanding graph representation
– Graphs can show trends, patterns, or comparisons in data.
– Relationship between variables
– Variables on a graph have a dependent and independent relationship.
– Reading the graph’s story
– Analyze what the graph’s trends and intersections mean.
– Interpreting data for solutions
– Use the graph to solve real-world problems.
|
This slide introduces students to the concept of interpreting graphs within the context of word problems. Start by discussing what different types of graphs represent and how they can visually display data. Explain the relationship between the independent variable (usually on the x-axis) and the dependent variable (on the y-axis), and how one variable affects the other. Guide students to ‘read’ the story a graph is telling by looking at its shape, the direction of trends, and what happens at key points like intersections. Finally, apply these interpretations to solve word problems, using the graph as a tool to extract necessary information. Encourage students to practice with different graphs and datasets to become comfortable with these concepts.
Word Problems and Graphs
– Translate problems into graphs
– Turn the story into a picture with axes
– Example: Graph a word problem
– We’ll solve a problem together step-by-step
– Group Activity: Graph creation
– Work in teams to draw a graph based on a problem
– Discuss solutions and methods
|
This slide is aimed at helping students understand how to interpret word problems and represent them graphically. Start by explaining the process of translating a word problem into a graph, emphasizing the importance of identifying variables and plotting them accordingly. Provide a clear example by walking through a word problem and creating a graph based on it. For the group activity, give each group a different word problem to translate into a graph, ensuring the problems vary in complexity. After the activity, discuss the different approaches and solutions each group came up with, highlighting effective strategies and common pitfalls. This will reinforce their understanding and encourage collaborative learning.
Class Activity: Graph Interpretation Challenge
– Pair up and interpret the provided graph
– Answer graph-related questions
– What does the graph show? Look for trends or patterns.
– Present your findings to the class
– Share your insights and how you arrived at them.
|
This activity is designed to enhance students’ ability to interpret information from a graph and to collaborate effectively. Provide a graph with two variables and a set of questions that guide students to analyze the graph’s data. Encourage them to discuss and identify trends, patterns, and relationships within the graph. After analyzing, students will prepare a short presentation to share their findings with the class, fostering public speaking and critical thinking skills. Possible variations of the activity could include interpreting different types of graphs, such as line graphs, bar graphs, or pie charts, to ensure a comprehensive understanding of graph interpretation.
Graph Interpretation: Conclusion & Homework
– Recap of graph interpretation
– Reviewed how to read and analyze graphs.
– Graphs in real-life scenarios
– Graphs are used in weather forecasts, finance, and sports.
– Homework: 3 word problems
– Solve problems using today’s lesson on interpreting graphs.
|
As we conclude today’s lesson on interpreting graphs, remind students of the key points covered. Emphasize the practical applications of graph interpretation skills in various aspects of everyday life, such as predicting weather patterns, understanding financial trends, or analyzing sports statistics. For homework, assign three graph-based word problems that require students to apply what they’ve learned. These problems should involve interpreting data from graphs to solve real-world scenarios. Encourage students to approach these problems methodically, using the steps discussed in class. Provide guidance on how to set up their solutions and remind them to refer to their notes from today’s lesson if they need help.


