Complete A Table For A Two-Variable Relationship
Subject: Math
Grade: Fifth grade
Topic: Variable Expressions
Please LOG IN to download the presentation. Access is available to registered users only.
View More Content
Introduction to Variable Expressions
– Understanding variables in math
– Variables are symbols like x or y that represent numbers
– Defining expressions
– Expressions are math phrases combining numbers and variables
– Relating variables and expressions
– Variables in expressions can change, affecting the expression’s value
– Exploring two-variable relationships
– In two-variable relationships, changes in one variable affect the other
|
This slide introduces the foundational concepts of variables and expressions, which are critical in understanding algebra and functions. Start by explaining that variables are like placeholders for numbers and can represent any value. Then, define expressions as combinations of numbers, variables, and operations (like addition or subtraction) that represent a value. Discuss how changing the value of a variable alters the expression’s value. Finally, introduce the concept of two-variable relationships, where two variables are connected in such a way that the change in one affects the other. Use simple examples to illustrate this, such as a relationship between hours worked and money earned. Encourage students to think of real-life situations that could be represented by variable expressions.
Exploring Two-Variable Relationships
– Define two-variable relationship
– When two things depend on each other, like speed and time.
– Real-life examples
– Distance vs. Time: More time, more distance covered.
– Graphs of two-variable relationships
– Show how one variable affects another on a graph.
– Understanding with a table
– Fill in a table to see the pattern between variables.
|
This slide introduces the concept of two-variable relationships, where one variable affects or is related to another. For example, the relationship between distance traveled and time taken. Students will learn how these relationships can be represented visually through graphs, making it easier to understand the connection between the variables. Additionally, they will practice completing tables that illustrate these relationships, reinforcing their comprehension of how changes in one variable impact the other. Encourage students to think of other examples where two variables might be related in their daily lives.
Tables and Two-Variable Relationships
– Organizing data with tables
– Tables help us sort and compare information easily.
– Identifying table variables
– Variables are things that can change, like ‘hours worked’ or ‘money earned’.
– Filling in missing data
– Use patterns or rules to find values for empty cells in the table.
– Understanding relationships
– See how changing one variable affects the other.
|
This slide introduces students to the concept of organizing data using tables and understanding two-variable relationships. Start by explaining how tables are useful for sorting information and making comparisons. Then, help students identify the variables in a table, which are typically represented in the columns or rows. Teach them how to look for patterns or use given rules to fill in missing information. Emphasize the importance of recognizing how variables are related; for example, how more hours worked could mean more money earned. Use simple, relatable examples to illustrate these concepts. Encourage students to practice with different tables and variables to solidify their understanding.
Creating a Table from a Relationship
– Understand variable relationships
– Variables can be things like time and distance that depend on each other.
– Steps to create a relationship table
– Identify variables, write an equation, then fill in the table.
– Example: Table from a word problem
– Use a story about distance traveled over time to make a table.
– Practice with different scenarios
– Try creating tables for things like money saved over weeks.
|
This slide introduces students to the concept of two-variable relationships and how to represent them in a table. Start by explaining that variables are quantities that can change and that they often depend on each other. For example, distance traveled depends on time. Next, outline the steps to create a table: identify the variables, write an equation that connects them, and use the equation to fill in the table. Provide a word problem as an example, such as calculating distance traveled over time, and show how to translate that into a table. Finally, encourage students to practice by creating tables from different scenarios, such as the amount of money saved each week. This will help them understand the practical application of the concept.
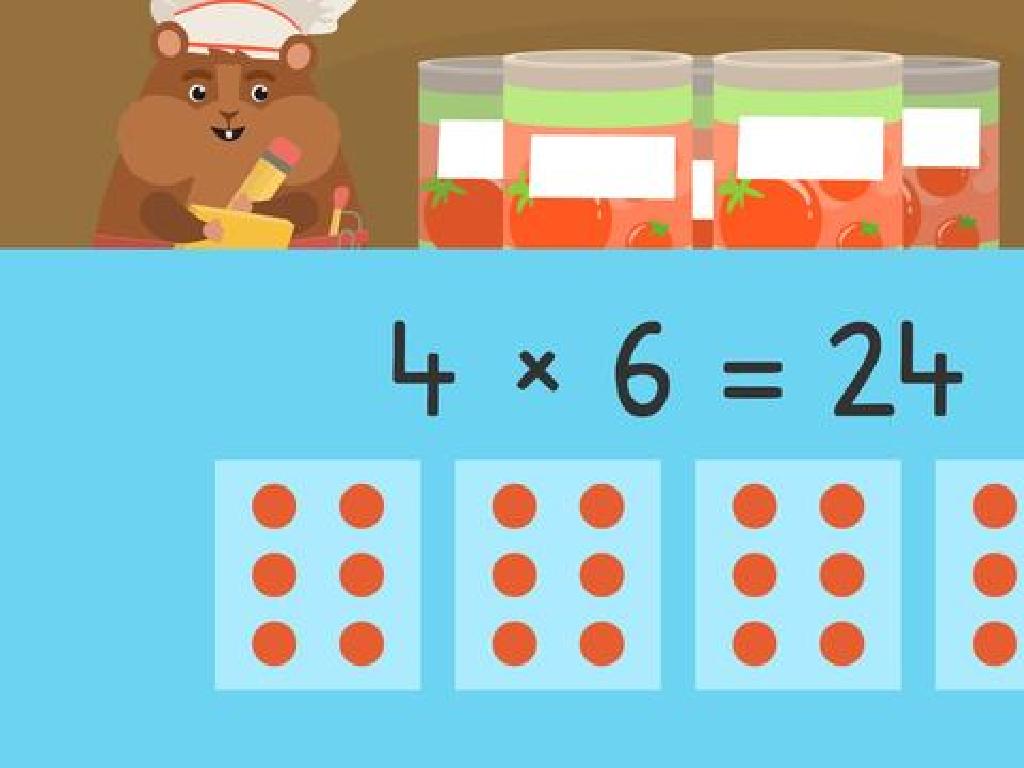
Completing a Table with Two Variables
– Use patterns to fill tables
– Recognize how numbers change in a pattern and use it to complete missing parts of a table.
– Work through a practice example
– Let’s solve a table together where some information is missing.
– Find solutions for unknowns
– Learn to solve for missing values when you know the relationship between the variables.
– Understand two-variable relationships
|
This slide introduces students to the concept of completing tables that represent two-variable relationships. Start by explaining how to identify patterns in tables, such as consistent increases or decreases in values. Use a practice example with some information given and some missing to demonstrate how to fill in the table. Guide students through finding solutions for unknown values by understanding the relationship between the two variables in the table. Emphasize the importance of recognizing patterns and relationships to predict and find missing values. For the class activity, provide several tables with different patterns and relationships for the students to complete. Possible activities could include tables with linear relationships, proportional relationships, or even simple addition or subtraction patterns.
Class Activity: Fill the Table!
– Group activity instructions
– Each group gets a unique table
– Tables show relationships between two variables
– Collaborate to complete the table
– Use patterns to fill in missing values
– Discuss findings with the class
– Share your strategy and results
|
This activity is designed to help students understand the relationship between two variables in a table format. Divide the class into small groups and provide each group with a different table that represents a two-variable relationship. Encourage students to work together to identify the pattern or rule that connects the two variables and use it to complete any missing entries in the table. After completing the table, each group will discuss their findings and the strategies they used to complete the table with the rest of the class. This will foster collaborative learning and enhance their problem-solving skills. Possible activities could include tables with addition, subtraction, multiplication, or division relationships, or even more complex functions like squares or cubes depending on the students’ proficiency levels.
Review and Reflect: Exploring Patterns
– Share your tables with classmates
– Discuss patterns in the tables
– How did the numbers change? Did they increase or decrease?
– Review key concepts from today
– Remember how variables and relationships work together
– Reflect on what you’ve learned
– Think about how this might be useful in real-life situations
|
This slide aims to consolidate the day’s learning by encouraging students to interact and engage with the material and each other. Students should be prepared to present the tables they’ve completed, focusing on the relationship between the two variables they’ve been working with. Facilitate a discussion on the patterns observed, guiding them to articulate their findings clearly. Reinforce the key concepts of variable relationships and how they can be represented in a table. Encourage students to reflect on the importance of these concepts and how they apply to real-world scenarios. This reflection will help solidify their understanding and appreciation of the material covered.
Homework Challenge: Exploring Variables
– Complete a two-variable table
– Fill in missing values using the relationship
– Share your findings in class
– Be ready to discuss how you completed the table
– Extra: Invent a variable relationship
– Create a table with your own set of rules
|
This homework task is designed to reinforce the concept of two-variable relationships. Students are expected to complete a table at home, filling in missing values based on the given relationship between the two variables. Encourage them to identify patterns and use them to find the missing information. For the extra challenge, students should create their own two-variable relationship and represent it in a table format. This will help them understand how variables can be related in different ways. In the next class, allocate time for students to share their tables and explain their thought process. This will foster a deeper understanding and allow for peer learning. For the extra challenge, students can explain the rules they created for their own tables.


